Home
    Visualizations & Analyses
    Discover & Contribute
    Hidden Figures
    Education
    About CSG
    CSG in the News
    API/Tools
    Glossary
CSG Logo

Visualizations

Listing of interactive visualizations exploring various attributes across computer system data sets. Powered by D3.js.
Computer Lineage
Computer Lineage

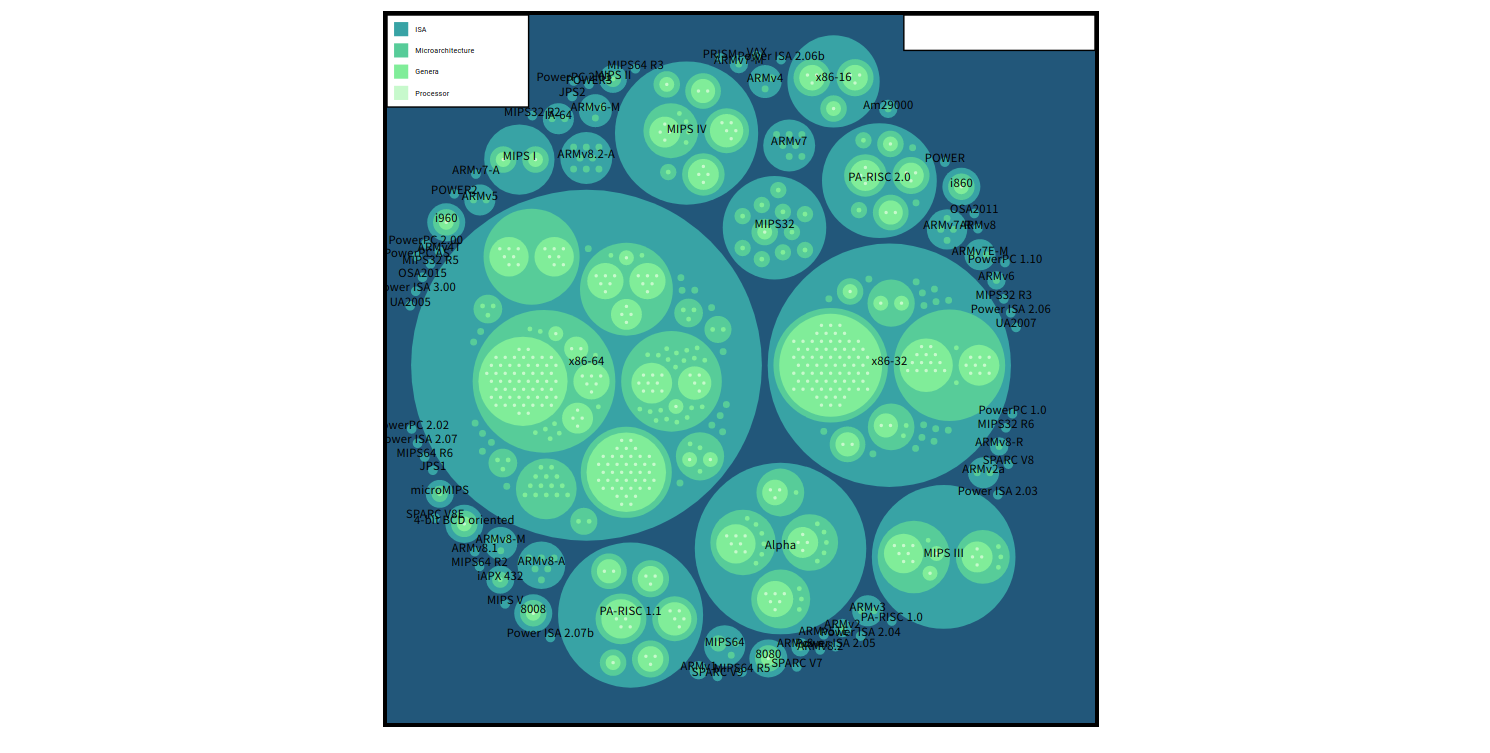
Ancestry of processors

Genome Hierarchy
Genome Hierarchy

Hierarchical visualization of our genome taxonomy

Top500 Ranks Timeline

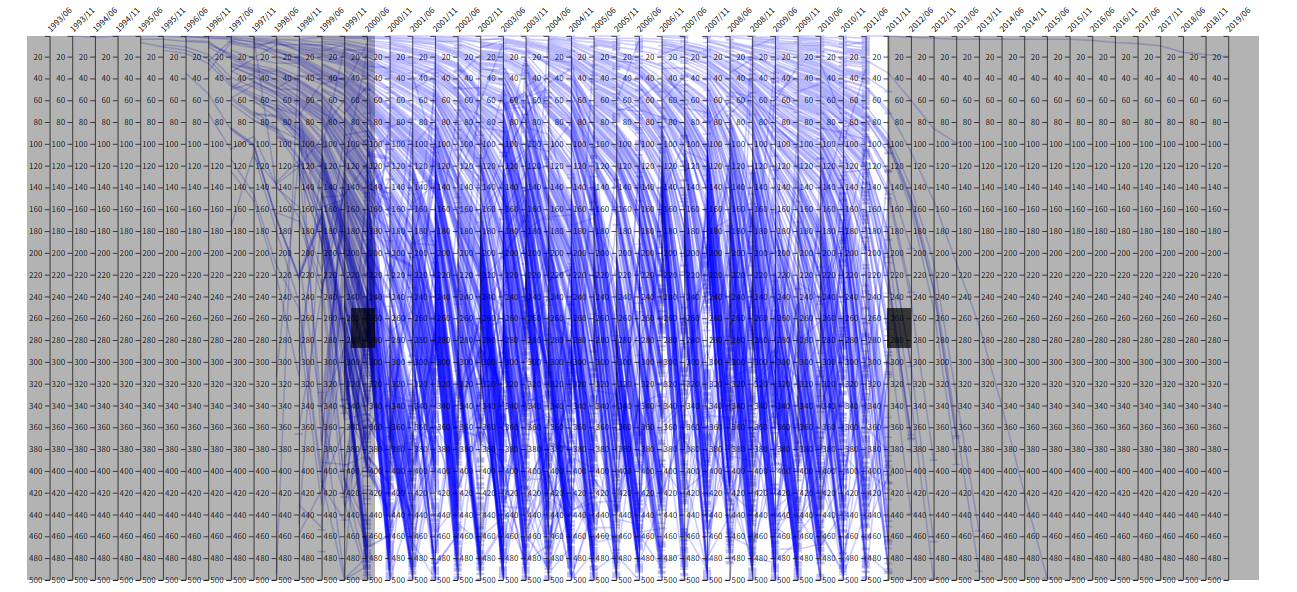
Timeline of Top500 Rankings per system

Top500 Map
Top500 Map

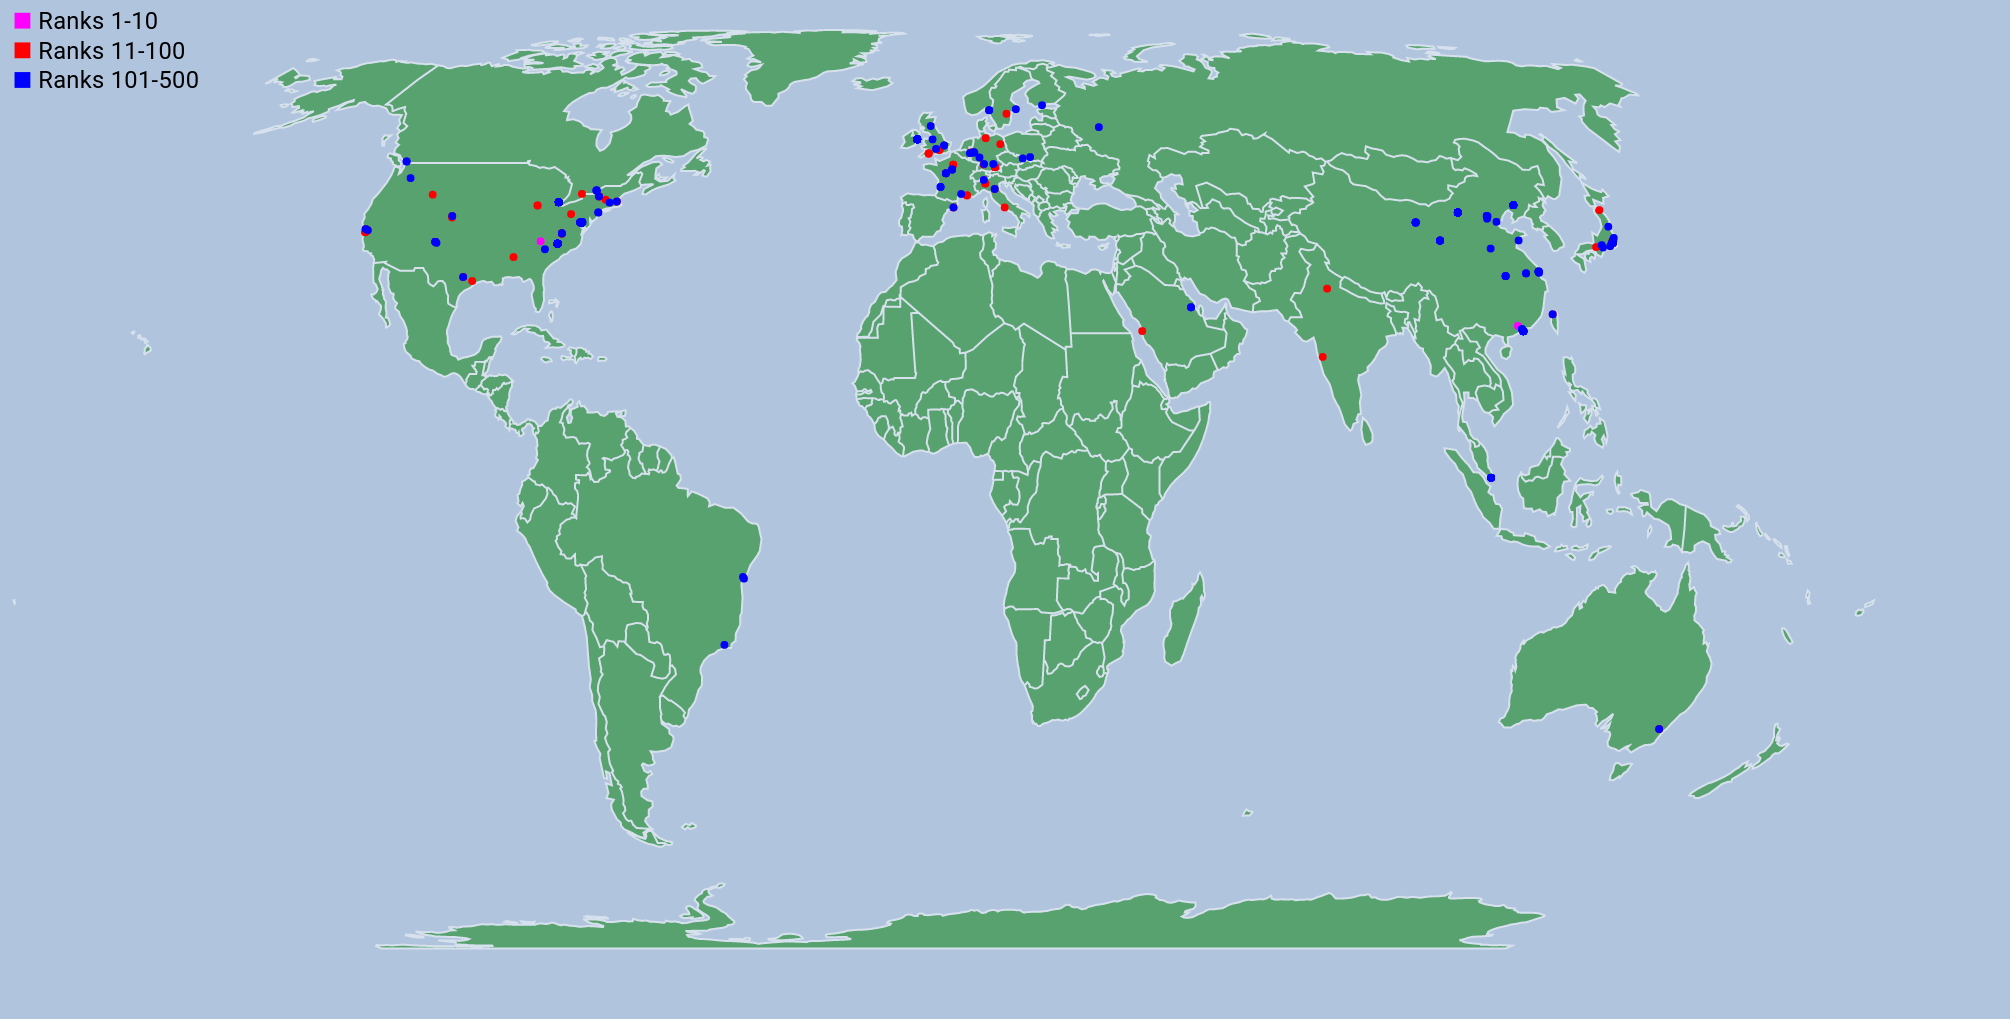
Interactive map of Top500 system locations

Genera Timeline
Genera Timeline

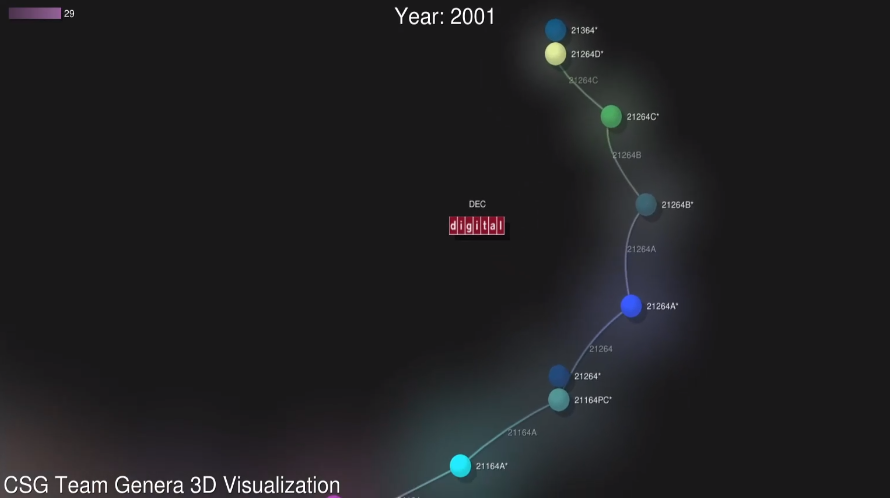
Video of genera over time

Memory Timeline
Memory Timeline

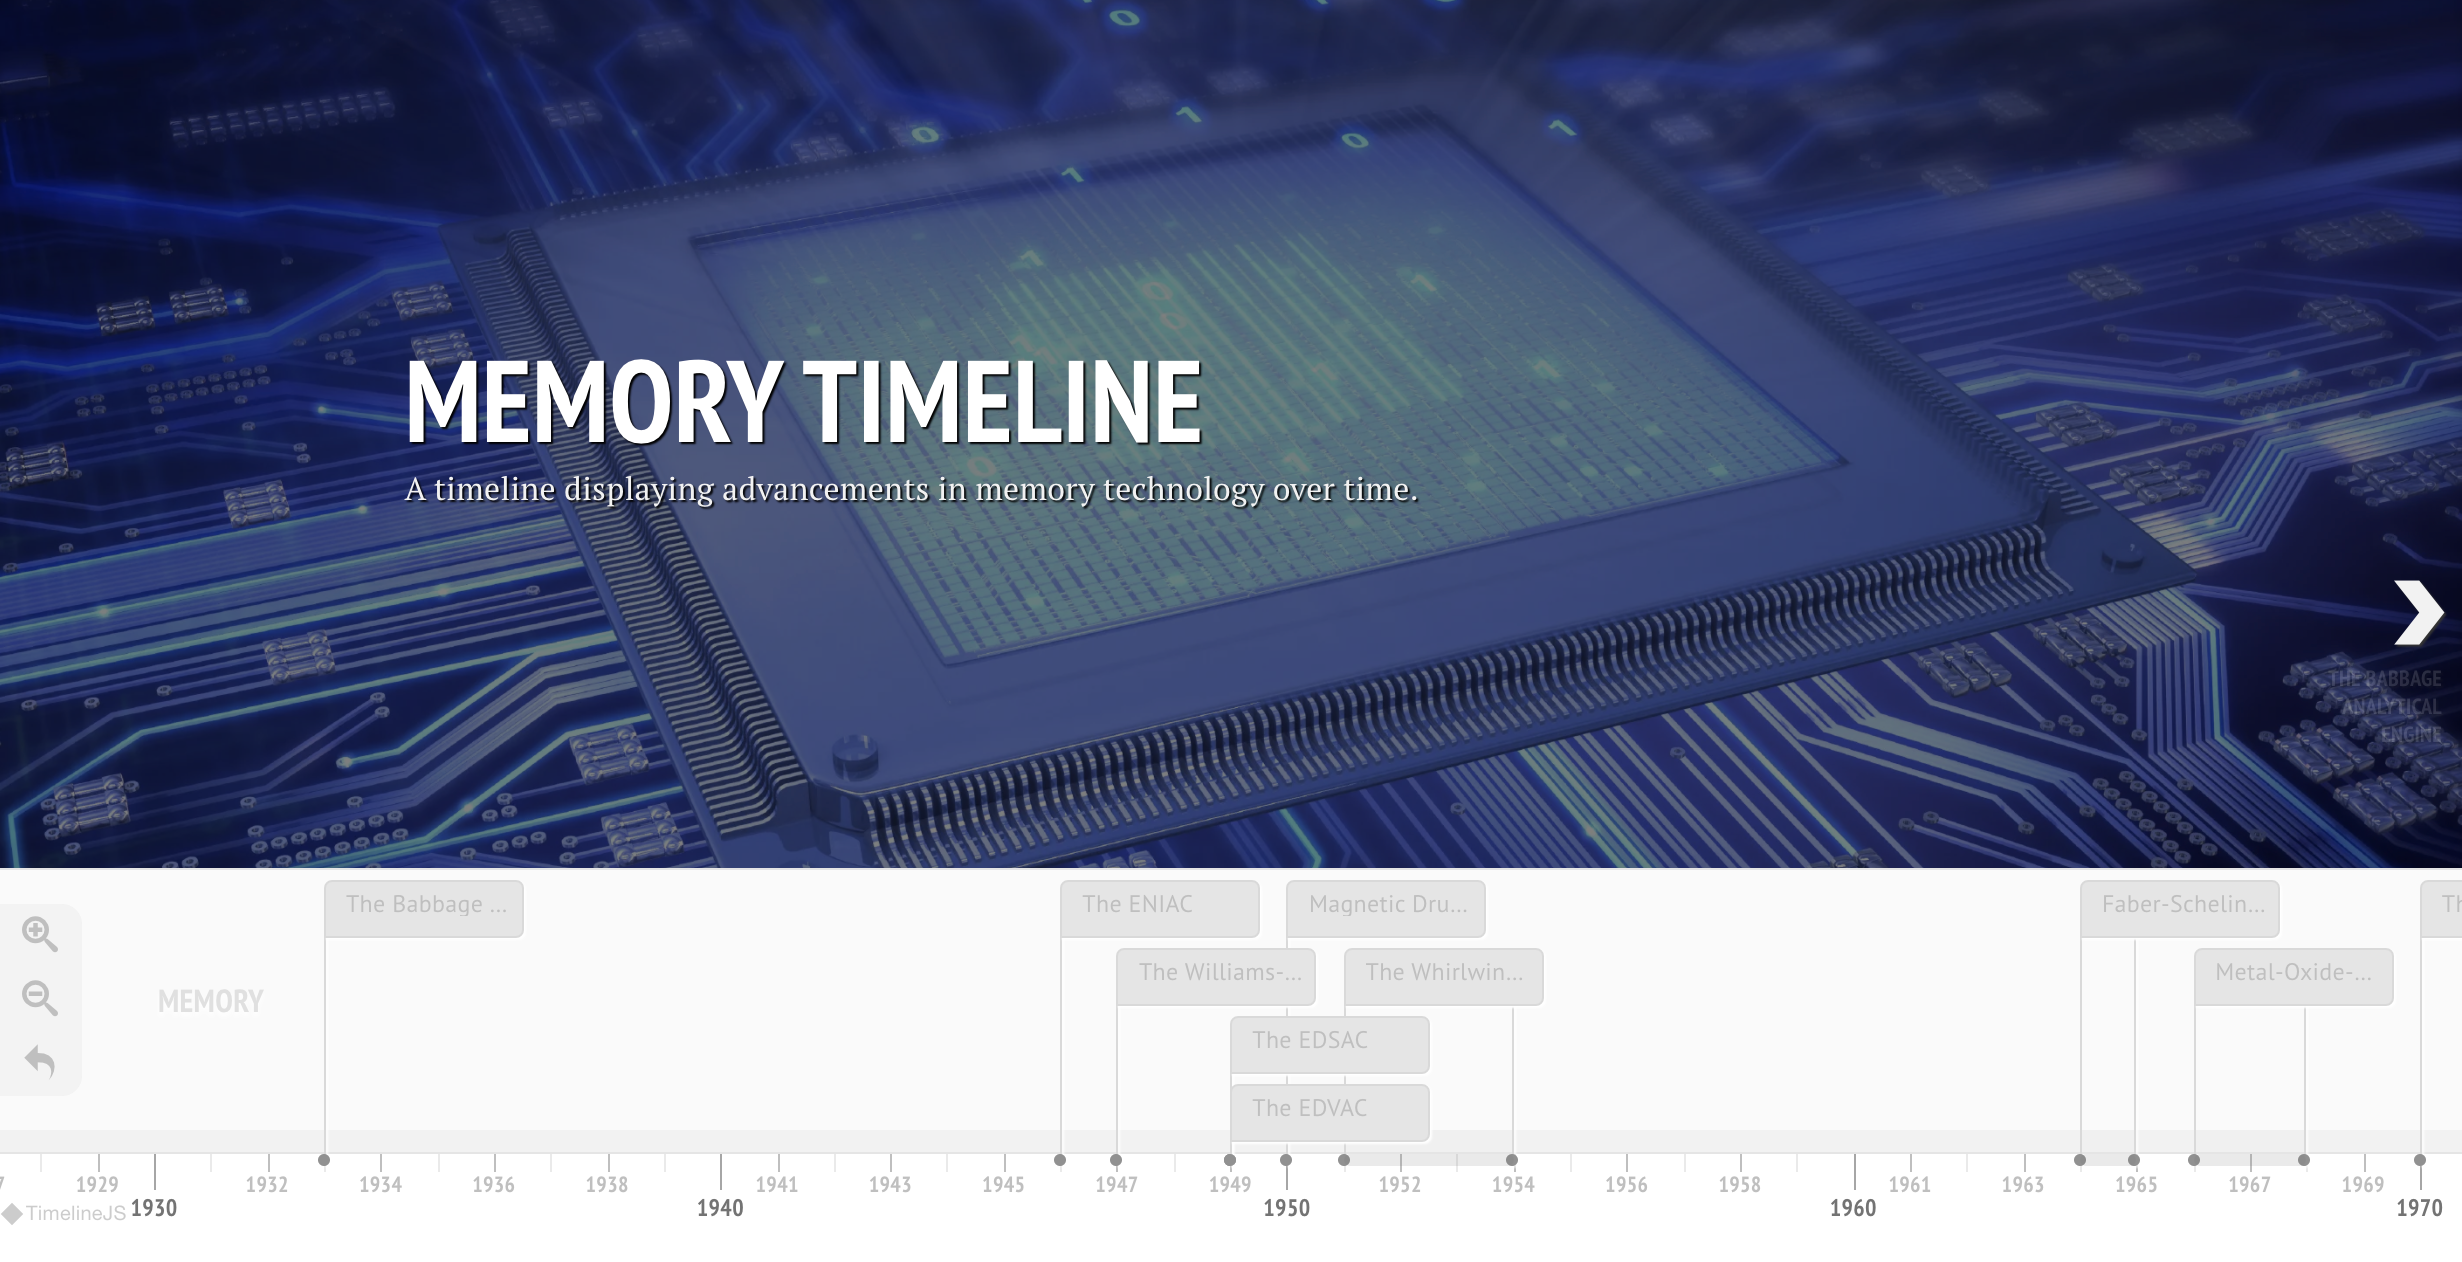
Interactive timeline displaying memory related advancements in technology

Word Cloud
Word Cloud

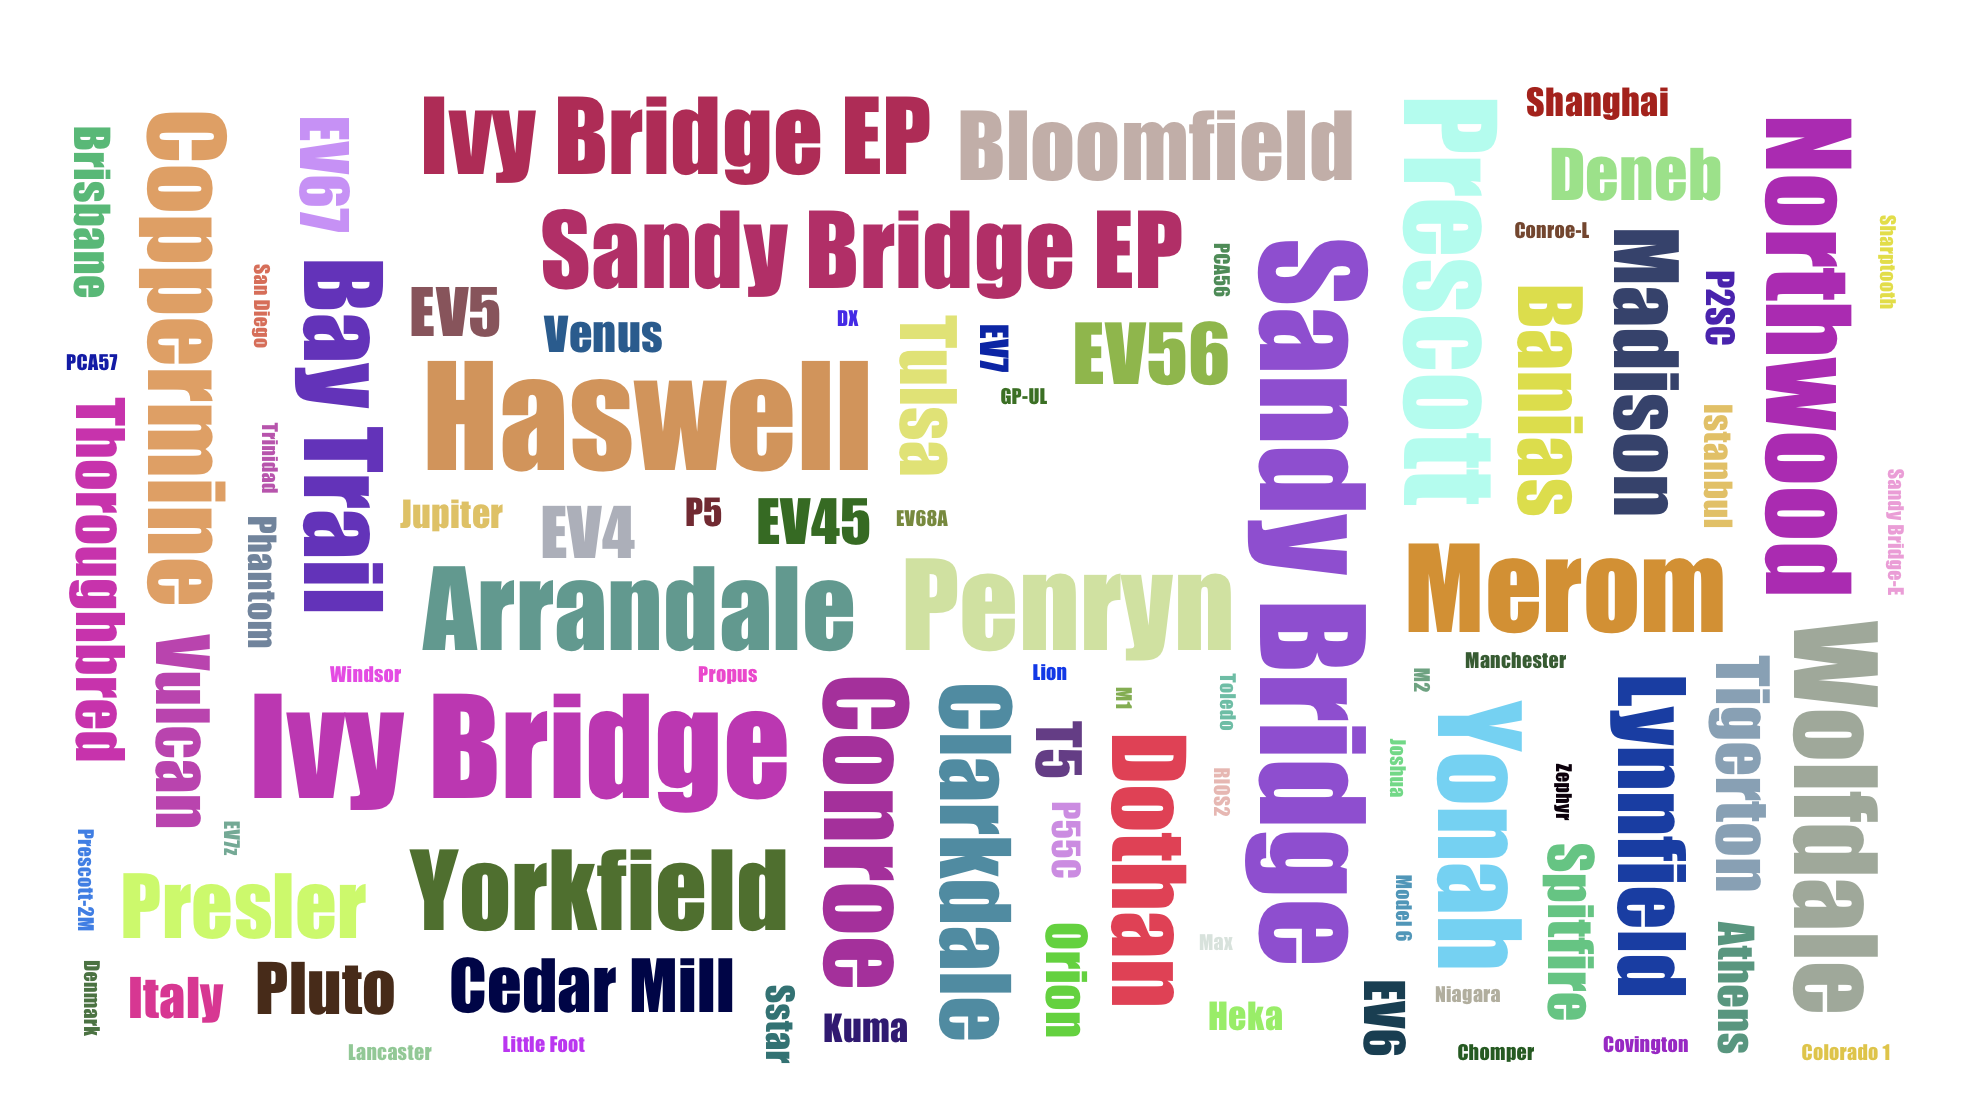
Interactive word cloud displaying computer processor data

Machine Learning
Machine Learning

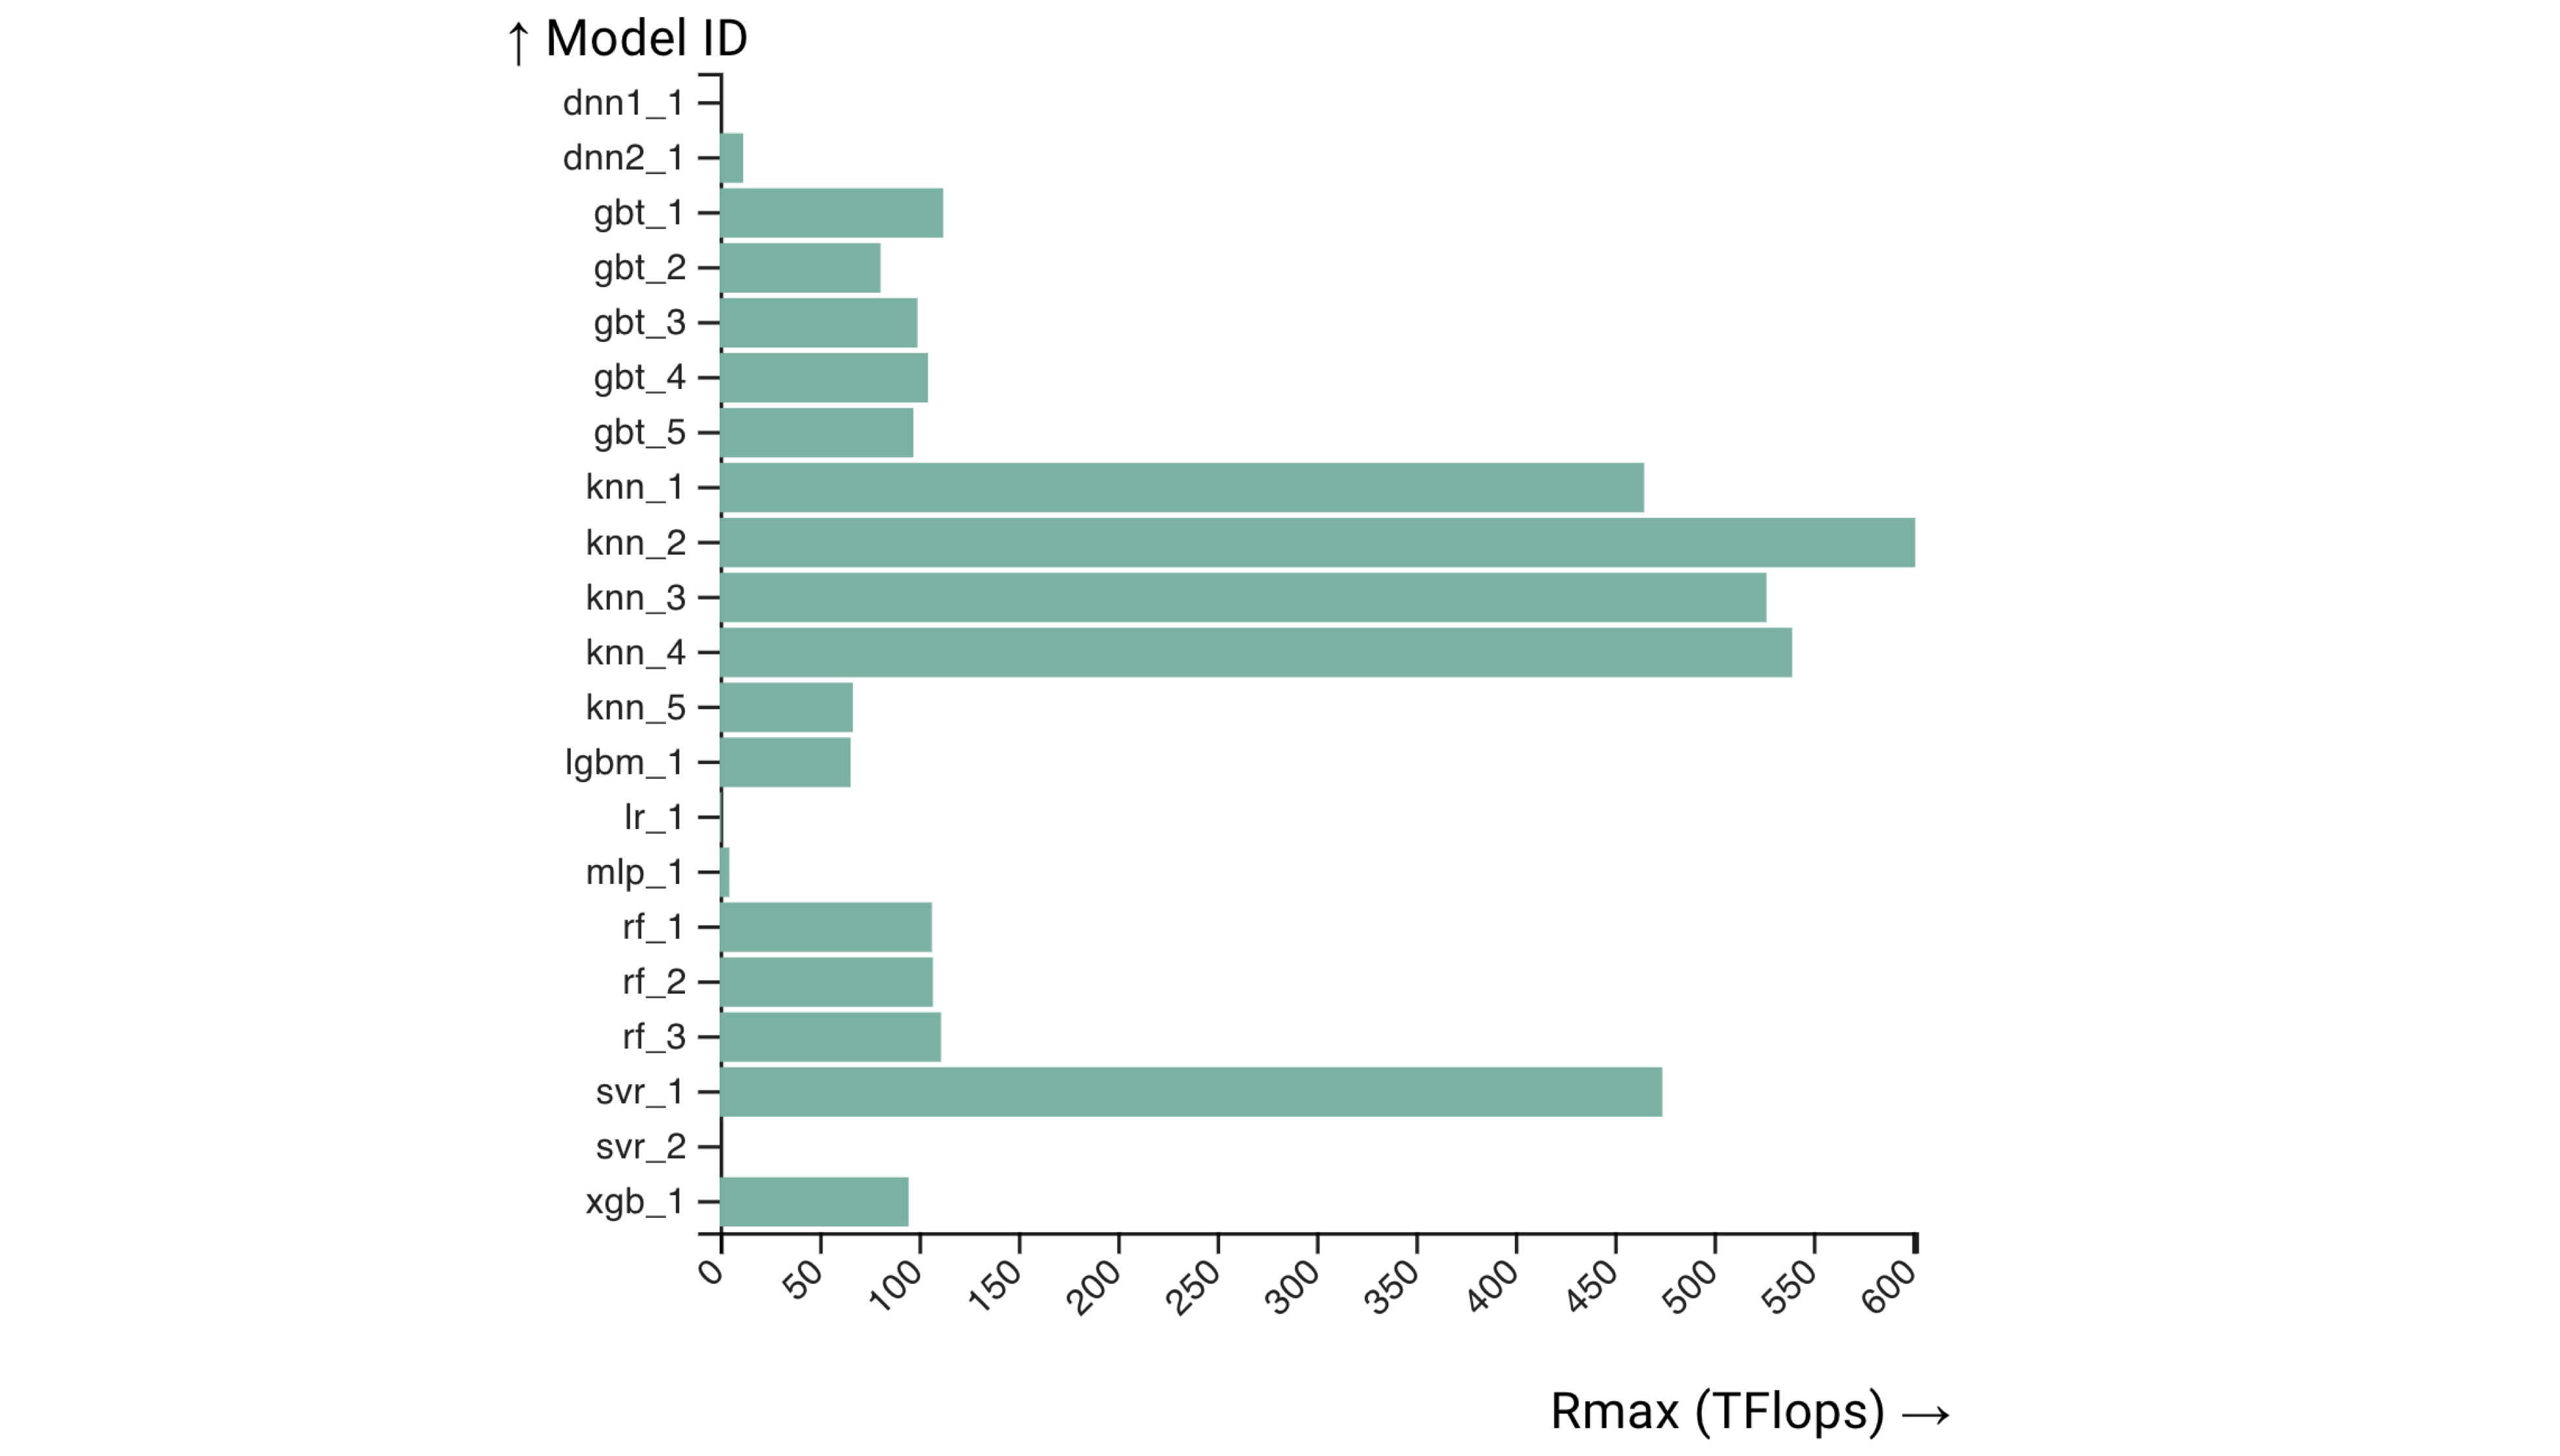
Predict performance and efficiency of custom systems using machine learning models

Google Trends Visualization

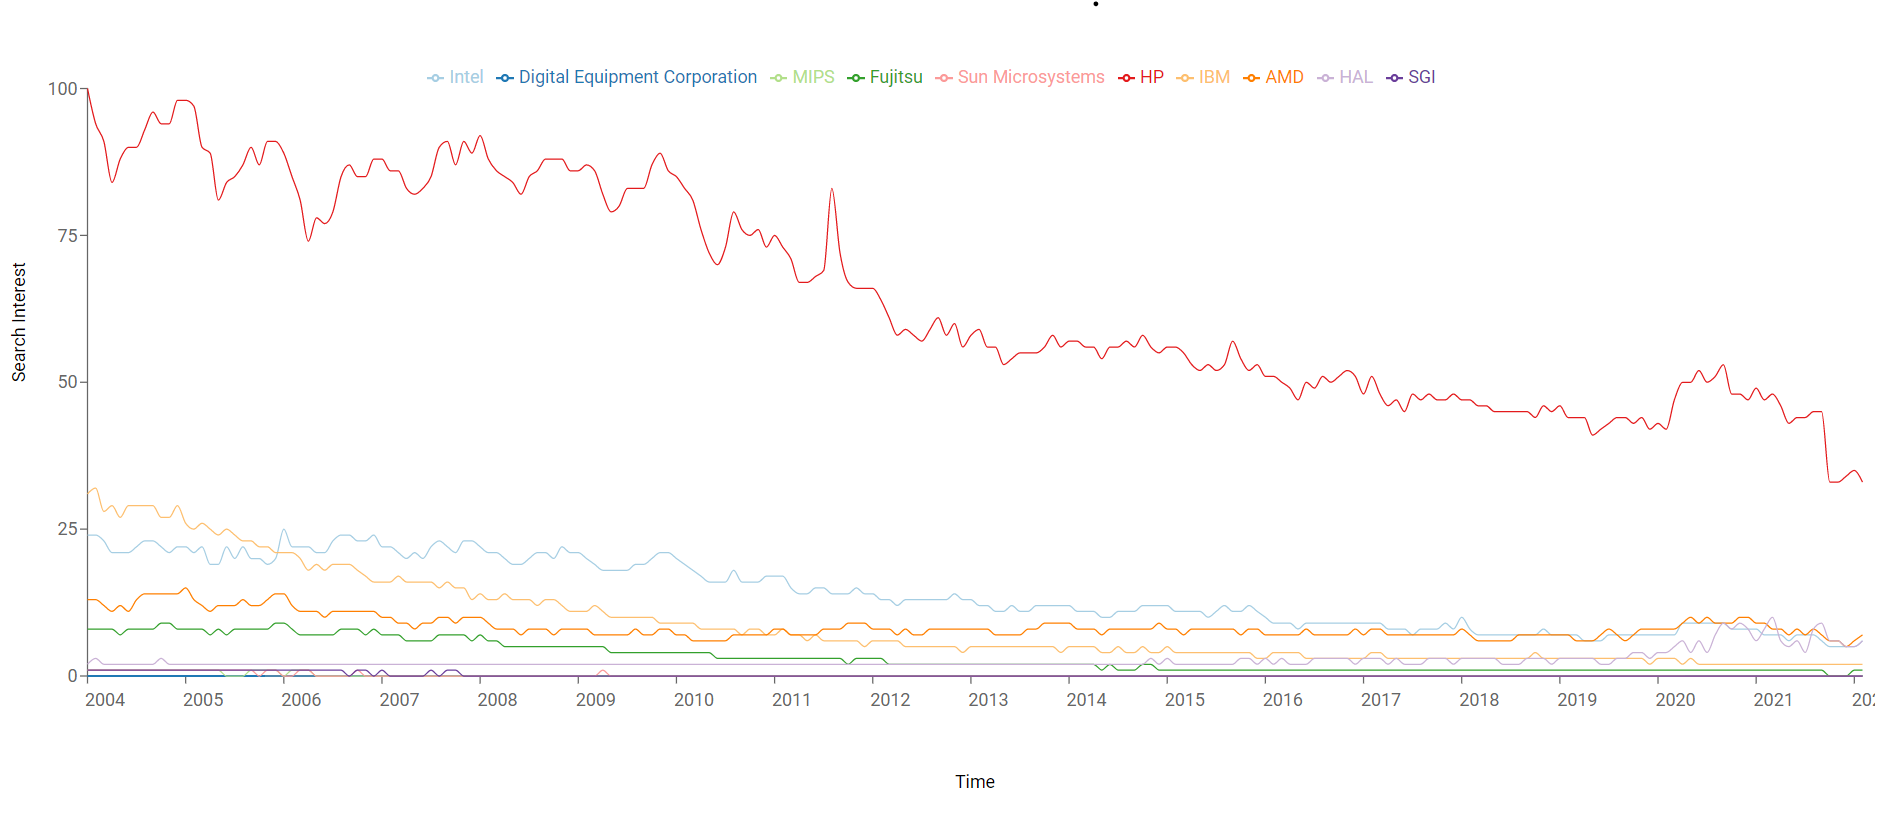
This visualization shows the change in interest over time of ten different processor manufacturers based on search volume data from Google Trends...

Powered by the CSG Team at Virginia Tech.